Quantcast
Channel: ComponentSource News | Components
Viewing all 12458 articles
Browse latest View live

GdPicture.NET v14.1.21

$
0
0
GdPicture.NET Document Imaging SDK Ultimate

Introduces support for page layouts with several columns in DOCX rasterizer engine.

Features

  • Improved Mixed Raster Content (MRC) engine.
  • Improved Scalable Vector Graphics (SVG) renderer.
  • Introduced support of page layouts with several columns in DOCX rasterizer engine.
  • Improved Optical Character Recognition (OCR) accuracy and stability with LSTM based dictionaries.
  • GdPicturePDF: Improved digital signature and certification processing.
  • GdPicturePDF: Improved forms editing support.
  • AnnotationManager: new method GetFirstAnnotationCommentIdx().
  • DocuVieware: improved user experience.

Fixes

  • Battery of minor bug fixes.

Telerik UI for Blazor 1.1.1

$
0
0
Telerik UI for Blazor

Includes updates for Grid, DatePicker and TabStrip.

Features

  • Common
    • Migrate online demos to server-side Blazor.
    • Web Installer and Control Panel are now available.

Fixes

  • Grid
    • Upon CommandButton click "Object reference not set to an instance of an object." is thrown in the console.
  • DatePicker
    • DatePicker throws exception upon selecting a date in a server-side scenario.
  • TabStrip
    • Rename RemoveTab() to DeactivateTab() to reflect the actual purpose of the method.

Telerik UI for Blazor is available as a standalone product and is also included in the following Telerik products:

  • Telerik DevCraft Ultimate
  • Telerik DevCraft Complete
  • Telerik DevCraft UI

Highcharts Suite v7.1.2

$
0
0
Highcharts Suite

Includes new vertically scrollable plot area, plus options in Highstock JS to control rendering lines across all panes.

Features

  • New in Highstock 7.1.2
    • Added new options plotBands.acrossPanes and plotLines.acrossPanes to control rendering lines across all panes.
  • New in Highcharts Basic 7.1.2
    • Added new feature, vertically scrollable plot area.
      This adds native scrolling features vertically, and is enabled using the chart.scrollablePlotArea.minHeight setting.
    • Deprecated the 'labels' option in favor of 'annotations'.
    • Added stack labels feature to waterfall series.
    • Added auto alignment for solid gauges with two labels.
    • Improved performance for exporting packedbubble series.
    • Added 'series.nodes[index].remove()' method to networkgraph series to remove a node with all connected links.
    • Added support for percentage value in yAxis.labels.distance option for gauge series.

Highcharts JS v7.1.2

$
0
0
Highcharts JS

Adds new feature to vertically scroll plot area, plus improvements for waterfall and packedbubble chart series.

Features

  • Added new feature, vertically scrollable plot area.
    This adds native scrolling features vertically, and is enabled using the chart.scrollablePlotArea.minHeight setting.
  • Deprecated the 'labels' option in favor of 'annotations'.
  • Added stack labels feature to waterfall series.
  • Added auto alignment for solid gauges with two labels.
  • Improved performance for exporting packedbubble series.
  • Added 'series.nodes[index].remove()' method to networkgraph series to remove a node with all connected links.
  • Added support for percentage value in yAxis.labels.distance option for gauge series.

Highmaps JS v7.1.2

$
0
0
Highmaps JS

Adds new feature to vertically scroll plot area, plus improvements for waterfall and packedbubble chart series.

Features

  • Added new feature, vertically scrollable plot area.
    This adds native scrolling features vertically, and is enabled using the chart.scrollablePlotArea.minHeight setting.
  • Deprecated the 'labels' option in favor of 'annotations'.
  • Added stack labels feature to waterfall series.
  • Added auto alignment for solid gauges with two labels.
  • Improved performance for exporting packedbubble series.
  • Added 'series.nodes[index].remove()' method to networkgraph series to remove a node with all connected links.
  • Added support for percentage value in yAxis.labels.distance option for gauge series.

Highstock JS v7.1.2

$
0
0
Highstock JS

Adds new options to control rendering lines across all panes, plus a vertically scrollable plot area.

Features

  • New in Highstock 7.1.2
    • Added new options plotBands.acrossPanes and plotLines.acrossPanes to control rendering lines across all panes.
  • New in Highcharts Basic 7.1.2
    • Added new feature, vertically scrollable plot area.
      This adds native scrolling features vertically, and is enabled using the chart.scrollablePlotArea.minHeight setting.
    • Deprecated the 'labels' option in favor of 'annotations'.
    • Added stack labels feature to waterfall series.
    • Added auto alignment for solid gauges with two labels.
    • Improved performance for exporting packedbubble series.
    • Added 'series.nodes[index].remove()' method to networkgraph series to remove a node with all connected links.
    • Added support for percentage value in yAxis.labels.distance option for gauge series.

Highcharts Gantt JS v7.1.2

$
0
0
Highcharts Gantt JS

Adds new feature to vertically scroll plot area, plus improvements for waterfall and packedbubble chart series.

Features

  • Added new feature, vertically scrollable plot area.
    This adds native scrolling features vertically, and is enabled using the chart.scrollablePlotArea.minHeight setting.
  • Deprecated the 'labels' option in favor of 'annotations'.
  • Added stack labels feature to waterfall series.
  • Added auto alignment for solid gauges with two labels.
  • Improved performance for exporting packedbubble series.
  • Added 'series.nodes[index].remove()' method to networkgraph series to remove a node with all connected links.
  • Added support for percentage value in yAxis.labels.distance option for gauge series.

Vizuly Bar Chart released

$
0
0
Vizuly Bar Chart

Add stacked and clustered bar charts to your JavaScript apps.

Features

Vizuly Bar Chart supports both stacked and clustered layout options, as well as over 2 dozen different dynamic styles. It also comes bundled with a test container and examples of different style based themes. You can use this component directly into your application using its straightforward API, or use it as a starting point for modification and extension.

Features

  • Drop-in Ready
  • Supports Stacked and Clustered Layouts
  • Over 2 dozen dynamic styles
  • Easily Modifiable
  • Built in customizable data tips
  • All Source Code - Fully Commented
  • Vizuly Open Source Framework

Framework Adapters

  • React Adapters
  • Angular Adapters
  • Vue.js Adapters

Vizuly Column Chart released

$
0
0
Vizuly Column Chart

Add stacked and clustered column charts to your JavaScript apps.

Features

Vizuly Column Chart supports both stacked and clustered layout options, as well as over 2 dozen different dynamic styles. It also comes bundled with a test container and examples of different style based themes. You can use this component directly into your application using its straightforward API, or use it as a starting point for modification and extension.

Features

  • Drop-in Ready
  • Supports Stacked and Clustered Layouts
  • Over 2 dozen dynamic styles
  • Easily Modifiable
  • Built in customizable data tips
  • All Source Code - Fully Commented
  • Vizuly Open Source Framework

Framework Adapters

  • React Adapters
  • Angular Adapters
  • Vue.js Adapters

Vizuly Corona released

$
0
0
Vizuly Corona

A radial line and area layout visualization.

Features

Vizuly Corona is a radial chart that provides angular and curved radial area line curves and supports both an overlap and stacked layout. It also features over a dozen different dynamic styles and comes bundled with an easy to use test container that demonstrates seven uniquely styled themes. Use the interactive style explorer on the left to view different style settings, themes, and other customizable properties.

Features

  • Supports Overlap and Stacked Layouts
  • 7 example themes
  • More than a dozen dynamic styles
  • Dozens of adjustable properties and interactive event support
  • Customizable Data Tips
  • Documentation

Framework Adapters

  • React Adapters
  • Angular Adapters
  • Vue.js Adapters

Vizuly Halo released

$
0
0
Vizuly Halo

Represent transactional relationships from a specified number of sources to a variable number of targets.

Features

Vizuly Halo uses several different data visualization techniques to represent transactional relationships from a specified number of sources to a variable number of targets. Sources are represented as segmented arcs along the circumference of the visual, and targets are shown as clustered circles in the middle of the chart. The length of each source arc is determined by a data bound variable you specify and the size and cluster group of each target circle can also be determined by data bound variables. The data structure used by the Halo component is abstract enough that it can be adapted to many different data sources. Use the interactive style explorer on the left to view different style settings, themes, and other customizable properties.

Features

  • 6 example themes
  • More than a dozen dynamic styles
  • Dozens of adjustable properties and interactive event support
  • Customizable Data Tips
  • Documentation

Framework Adapters

  • React Adapters
  • Angular Adapters
  • Vue.js Adapters

Vizuly Line Area Chart released

$
0
0
Vizuly Line Area Chart

Add line and area charts to your JavaScript apps.

Features

Vizuly Line Area Chart supports both line and area plots in several different layout options. It also comes bundled with a test container demonstrating the various chart properties and different style themes. You can either drop this component directly into your application using its straightforward API, or use it as a starting point for modification and extension.

Features

  • Supports Overlap, Stacked, and Stream Layouts
  • 6 example themes
  • More than a dozen dynamic styles
  • Dozens of adjustable properties and interactive event support
  • Customizable Data Tips
  • Documentation

Framework Adapters

  • React Adapters
  • Angular Adapters
  • Vue.js Adapters

Vizuly Radar Chart released

$
0
0
Vizuly Radar Chart

Add Radar charts to your JavaScript apps.

Features

Vizuly Radar Chart graphs multiple dimensions of one datum along multiple radial axis. Each plot represents 3 or more data points along shared axis lines. This chart supports highlighting of both individual data points and the group as a whole.

Features

  • Supports Vertex Point and Group Highlighting
  • Angular or Curve Line Types
  • 6 example themes
  • More than a dozen dynamic styles
  • Dozens of adjustable properties and interactive event support
  • Customizable Data Tips
  • Documentation

Framework Adapters

  • React Adapters
  • Angular Adapters
  • Vue.js Adapters

Vizuly Radial Bar released

$
0
0
Vizuly Radial Bar

Represent cartesian x/y data within a radial plot.

Features

Vizuly Radial Bar is designed to represent cartesian x/y data within a radial plot. It supports both clustered and stacked radial bars Use the interactive style explorer on the left to view different style settings, themes, and other customizable properties.

Features

  • Supports clustered and stacked layouts
  • 6 example themes
  • More than a dozen dynamic styles
  • Dozens of adjustable properties and interactive event support
  • Customizable Data Tips
  • Documentation

Framework Adapters

  • React Adapters
  • Angular Adapters
  • Vue.js Adapters

Vizuly Radial Progress released

$
0
0
Vizuly Radial Progress

Show numeric values within a minimum and maximum range.

Features

Vizuly Radial Progress is designed to show numeric values within a minimum and maximum range. It can also show when a value has exceeded the maximum threshold. This chart supports a variable range of start/stop angles, arc end caps, and comes bundled with different customizable themes.

Features

  • Adjust arc span angles
  • Adjustable stroke end caps (round/square)
  • Customizable top/bottom/value labels
  • 6 example themes
  • More than a dozen dynamic styles
  • Documentation

Framework Adapters

  • React Adapters
  • Angular Adapters
  • Vue.js Adapters

Vizuly Ring Chart released

$
0
0
Vizuly Ring Chart

Easily display multi-variate time series information.

Features

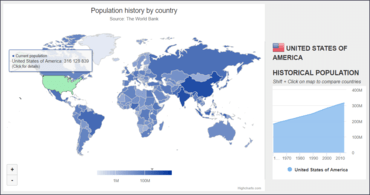
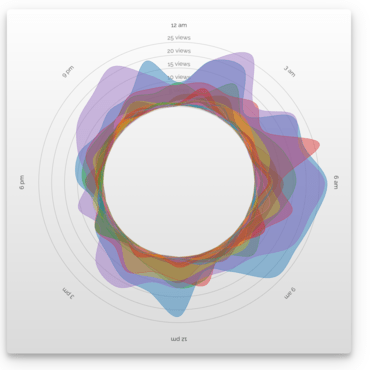
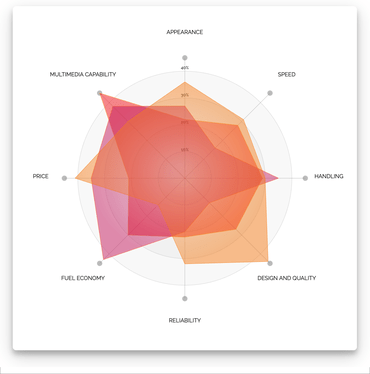
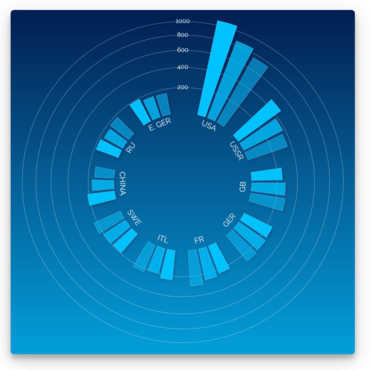
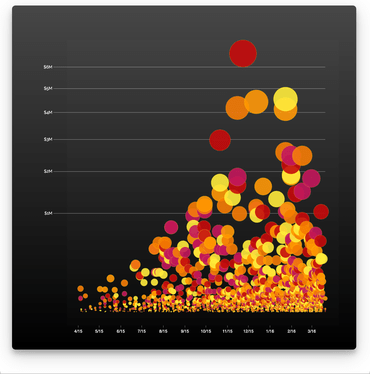
Vizuly Ring Chart lets you easily display multi-variate time series information. Due to its radial form factor, you can display 3 times the information for a given screen width than you could with a more traditional cartesian layout. You can plot one or more series using either a bar (stacked), line/area, or scatter layout. Each series can be uniquely styled and customized. In addition, the Ring Chart provides over 4 dozen customizable styles and a universal interaction model which shows the user the exact date and highlight for a given mouse position. Use the interactive style explorer on the left to view different style settings, themes, and other customizable properties.

Features

  • Supports Bar, Scatter, and Line Area Series
  • 5 example themes
  • More than four dozen dynamic styles
  • Dozens of adjustable properties and interactive event support
  • Customizable Data Tips
  • Documentation

Framework Adapters

  • React Adapters
  • Angular Adapters
  • Vue.js Adapters

Vizuly Scatter Plot released

$
0
0
Vizuly Scatter Plot

Add Scatter Plot charts to your JavaScript apps.

Features

Vizuly Scatter Plot shows 3 dimensions of data at once by plotting values along both the x and y axis as well as the radius of the plot itself. Each plot can be colored and styled dynamically based on your data.

Features

  • Supports Dynamic Scales for Radius and Plots
  • 5 example themes
  • More than a dozen dynamic styles
  • Dozens of adjustable properties and interactive event support
  • Customizable Data Tips
  • Documentation

Framework Adapters

  • React Adapters
  • Angular Adapters
  • Vue.js Adapters

Vizuly Sunburst released

$
0
0
Vizuly Sunburst

Add Sunburst charts to your JavaScript apps.

Features

Vizuly Sunburst is designed to represent hierarchical data in a radial plot. It supports drill down and drill up capabilities by allowing the user to collapse and expand segments of the sunburst when they click on that area.

Features

  • Supports Dynamic Scales for Radius and Plots
  • 6 example themes
  • More than a dozen dynamic styles
  • Dozens of adjustable properties and interactive event support
  • Customizable Data Tips
  • Documentation

Framework Adapters

  • React Adapters
  • Angular Adapters
  • Vue.js Adapters

Vizuly Tree Map released

$
0
0
Vizuly Tree Map

Add Tree Map charts to your JavaScript apps.

Features

Vizuly Tree Map visualizes hierarchical data in nested rectangular plots where the area of each rectangle is bound to a data property you can set. This TreeMap also supports the ability to drill down/up, in addition to a navigation “bread-crumb” at the top of the visualization. In addition to several different fill/stroke styles you can adjust the padding between and within elements and provide header titles to each section.

Features

  • Supports Drill Down/Up
  • Interactive Navigation Header
  • 6 example themes
  • More than a dozen dynamic styles
  • Dozens of adjustable properties and interactive event support
  • Customizable Data Tips
  • Documentation

Framework Adapters

  • React Adapters
  • Angular Adapters
  • Vue.js Adapters

Vizuly Venn Diagram released

$
0
0
Vizuly Venn Diagram

Add Venn Diagram charts to your JavaScript apps.

Features

Vizuly Venn Diagram shows all possible logical relations between a finite collection of different sets. This chart depicts elements as points in the plane, and sets as regions inside closed curves. A Venn diagram consists of multiple overlapping closed curves, usually circles, each representing a set. Using data bound dynamic styles you can declare different colors and visual attributes unique to each set.

Features

  • 6 example themes
  • Several dynamic styles
  • Adjustable properties and interactive event support
  • Customizable Data Tips
  • Documentation

Framework Adapters

  • React Adapters
  • Angular Adapters
  • Vue.js Adapters
Viewing all 12458 articles
Browse latest View live


<script src="https://jsc.adskeeper.com/r/s/rssing.com.1596347.js" async> </script>